
Brands enter into multiple sponsorship deals because they want to increase brand awareness (among other objectives) across different audiences at different events. But the return on these marketing investments can be difficult to put a number on, making the investments tricky to justify. How can you determine which sponsorships will be most effective?
Sometimes, there may be significant overlap among fan bases—quite a few ice hockey fans also enjoy basketball, for example. Is it cost-effective to sponsor both local teams? Or would you be better served by sponsoring just one of them and moving the other investment to something like Olympic badminton in hopes of reaching a much different audience?
Partnerships can range from the largest international events in the world to supporting a local flower festival. An NBA or NHL game might have stronger attendance, but a local partnership might make a stronger impression within a community. Can smaller, locally-focused events produce the results you’re looking for?
These aren’t easy questions to answer, but many of our clients at KORE use deal scoring to gain effective insights. In theory, the process is straightforward—identify your investment goals and establish scoring metrics for those goals, then comparing those scores against the money spent. In practice, this means asking a lot of questions.
Let’s look at an example of how one brand leverages KORE Planning & Insights (KPI) consulting to measure their array of investments. This brand sponsors multiple types of entertainment including sports, concerts, and local festivals. When we collaborate with a brand like this, we begin the deal scoring process with questions like:
- Who do you have partnerships with?
- Collecting partnership deals and categorizing them by type of rights, events, and/or assets brands are entitled to.
- What are the different value drivers?
- Evaluate different pillars to measure.
- What data sources do we need to consider, and how do we display them together?
- Different objectives likely live across multiple data sources: Zoomph for social media, Google Analytics for website traffic, Nielsen for research, etc.
- What are your objectives and how are they weighted?
- Leverage metrics to identify scores for what they want to achieve from each partnership, then aggregate the data in a centralized location.
- How is your portfolio performing compared to your goals and expectations?
- The evaluation process considers both the quantitative and qualitative factors previously established.
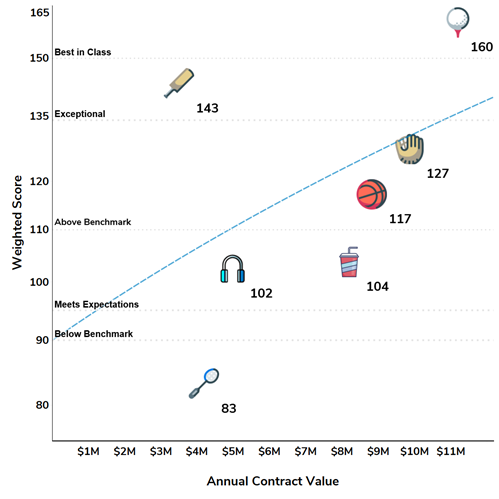
After metrics have been accounted for and evaluations have been centralized, weighted, and scored, we can plot them on a graph to visualize the portfolio: